Gyroscope Community Dashboard - Powered by Chainrisk
The Chainrisk team is proud to announce the launch of the Gyroscope Community Dashboard. This dashboard offers users and developers insights into its supply dynamics, liquidity, and stability. The dashboard is linked to a live monitoring tool, accessible via Chainrisk's platform, enabling users to track the performance and status of $GYD in real-time.
Platform Overview
The dashboard provides users with a holistic view of Gyroscope, including insights on TVL (Total Value Locked), $GYD supply, price data, and excess reserve asset values.
It serves as a hub for understanding key performance indicators, offering detailed and dynamic reports that adapt to changes in the market, supporting informed decision-making for users.
TVL by Chain
The dashboard offers detailed analytics on the distribution of TVL across multiple blockchains where $GYD operates, including Arbitrum, Ethereum, Polygon, Optimism, Gnosis Chain, and Polygon ZkEVM.
Users can see how assets are distributed across these chains, helping to understand where liquidity is concentrated and how $GYD is performing on different platforms.
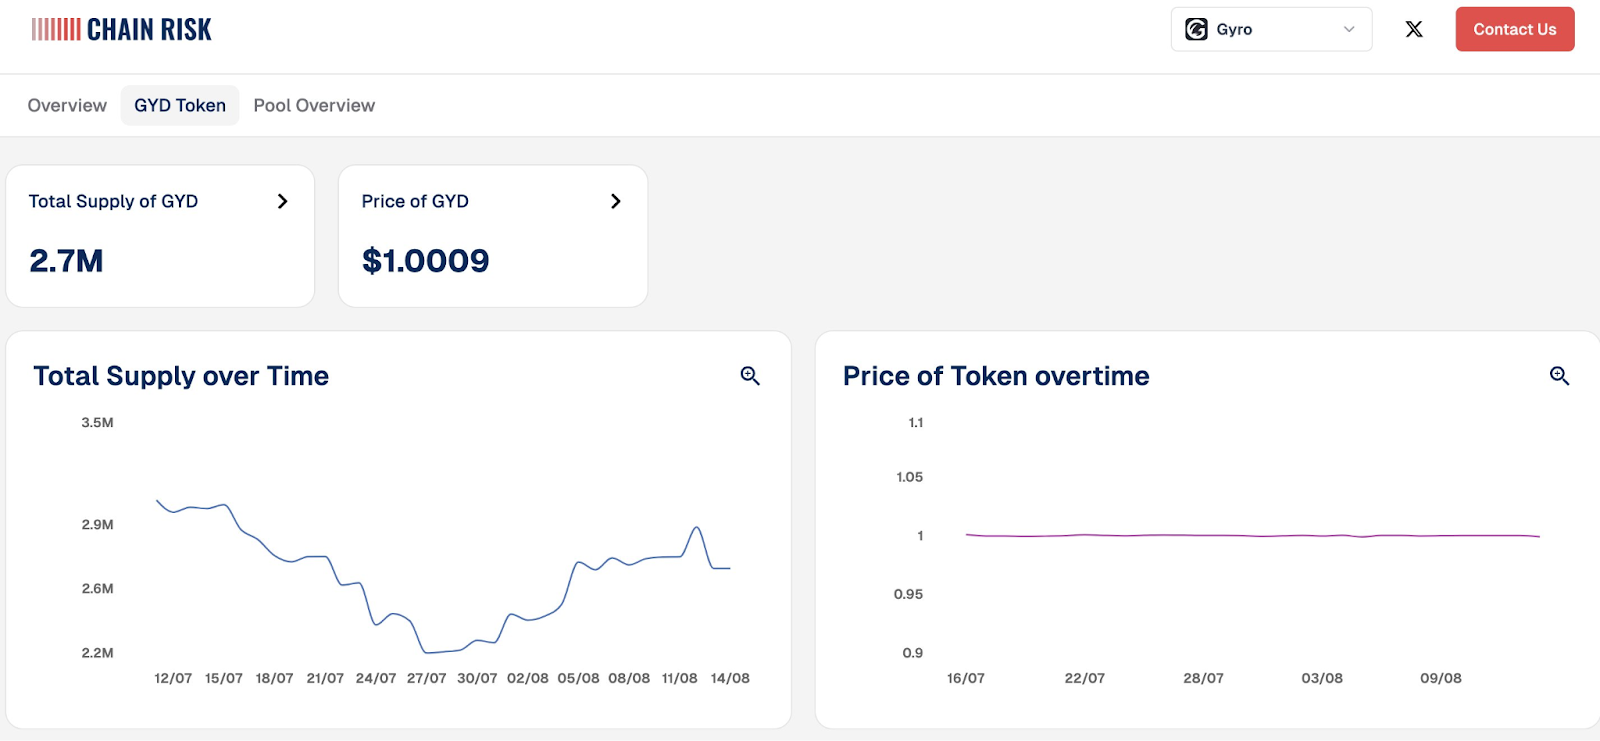
$GYD Token Analytics
The dashboard tracks the historical and current total supply of $GYD, allowing users to observe trends and understand changes in supply over time.
It includes price data to monitor how stable $GYD has been, which is crucial for a stablecoin’s performance assessment. Insights into the mechanisms maintaining price stability can help users and developers make informed decisions about usage and integration. Users can access data about the collateralization ratios, providing information on how well-backed $GYD is, ensuring its security and stability.
The $GYD Holders List provides a detailed breakdown of top holders by address, displaying their corresponding values, percentages, & balances, offering transparency into the distribution of $GYD holdings.
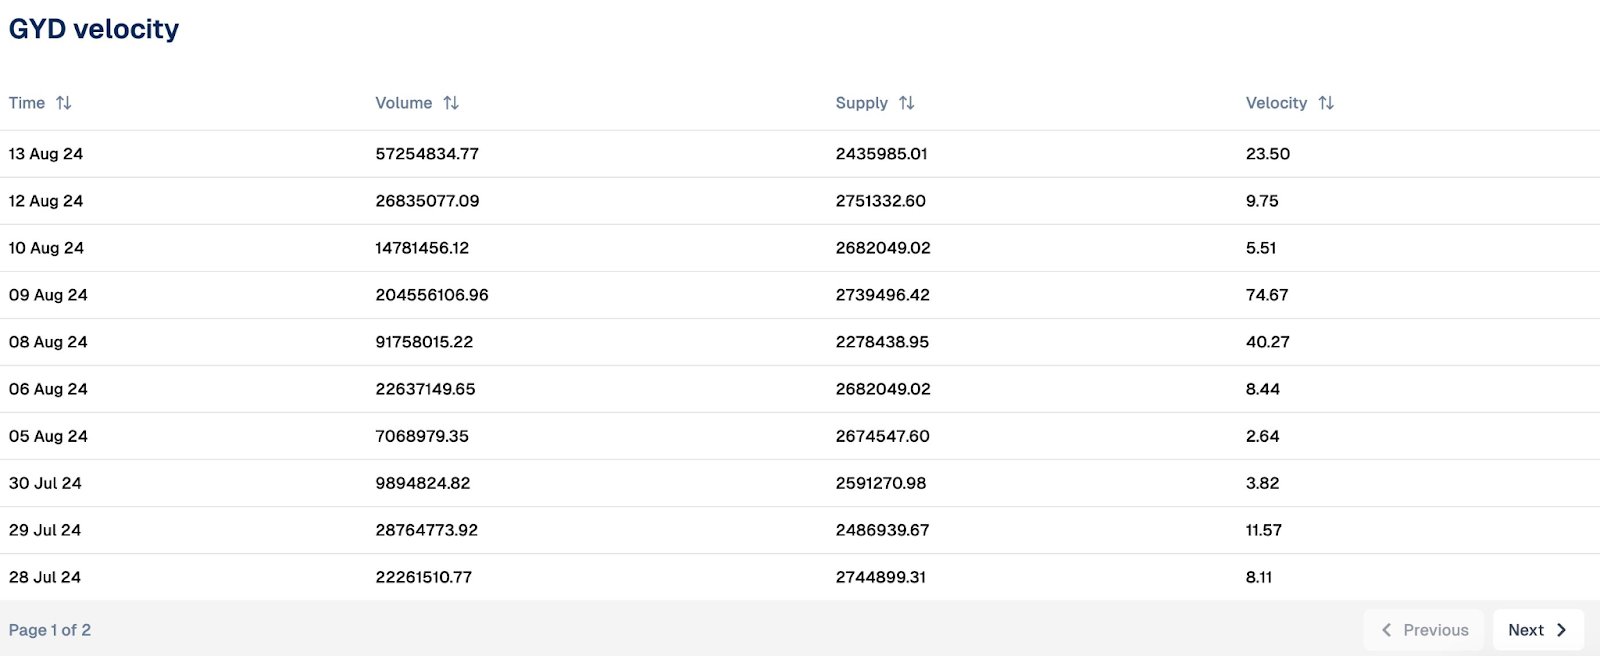
$GYD Velocity feature focuses on the velocity of $GYD, i.e., the rate at which $GYD is circulating within the market on a daily basis. By analyzing the volume, supply, and calculated velocity, users can understand the level of activity and how frequently $GYD is used in transactions.
This metric can indicate adoption rates and market liquidity, offering a clearer view of $GYD's market dynamics.
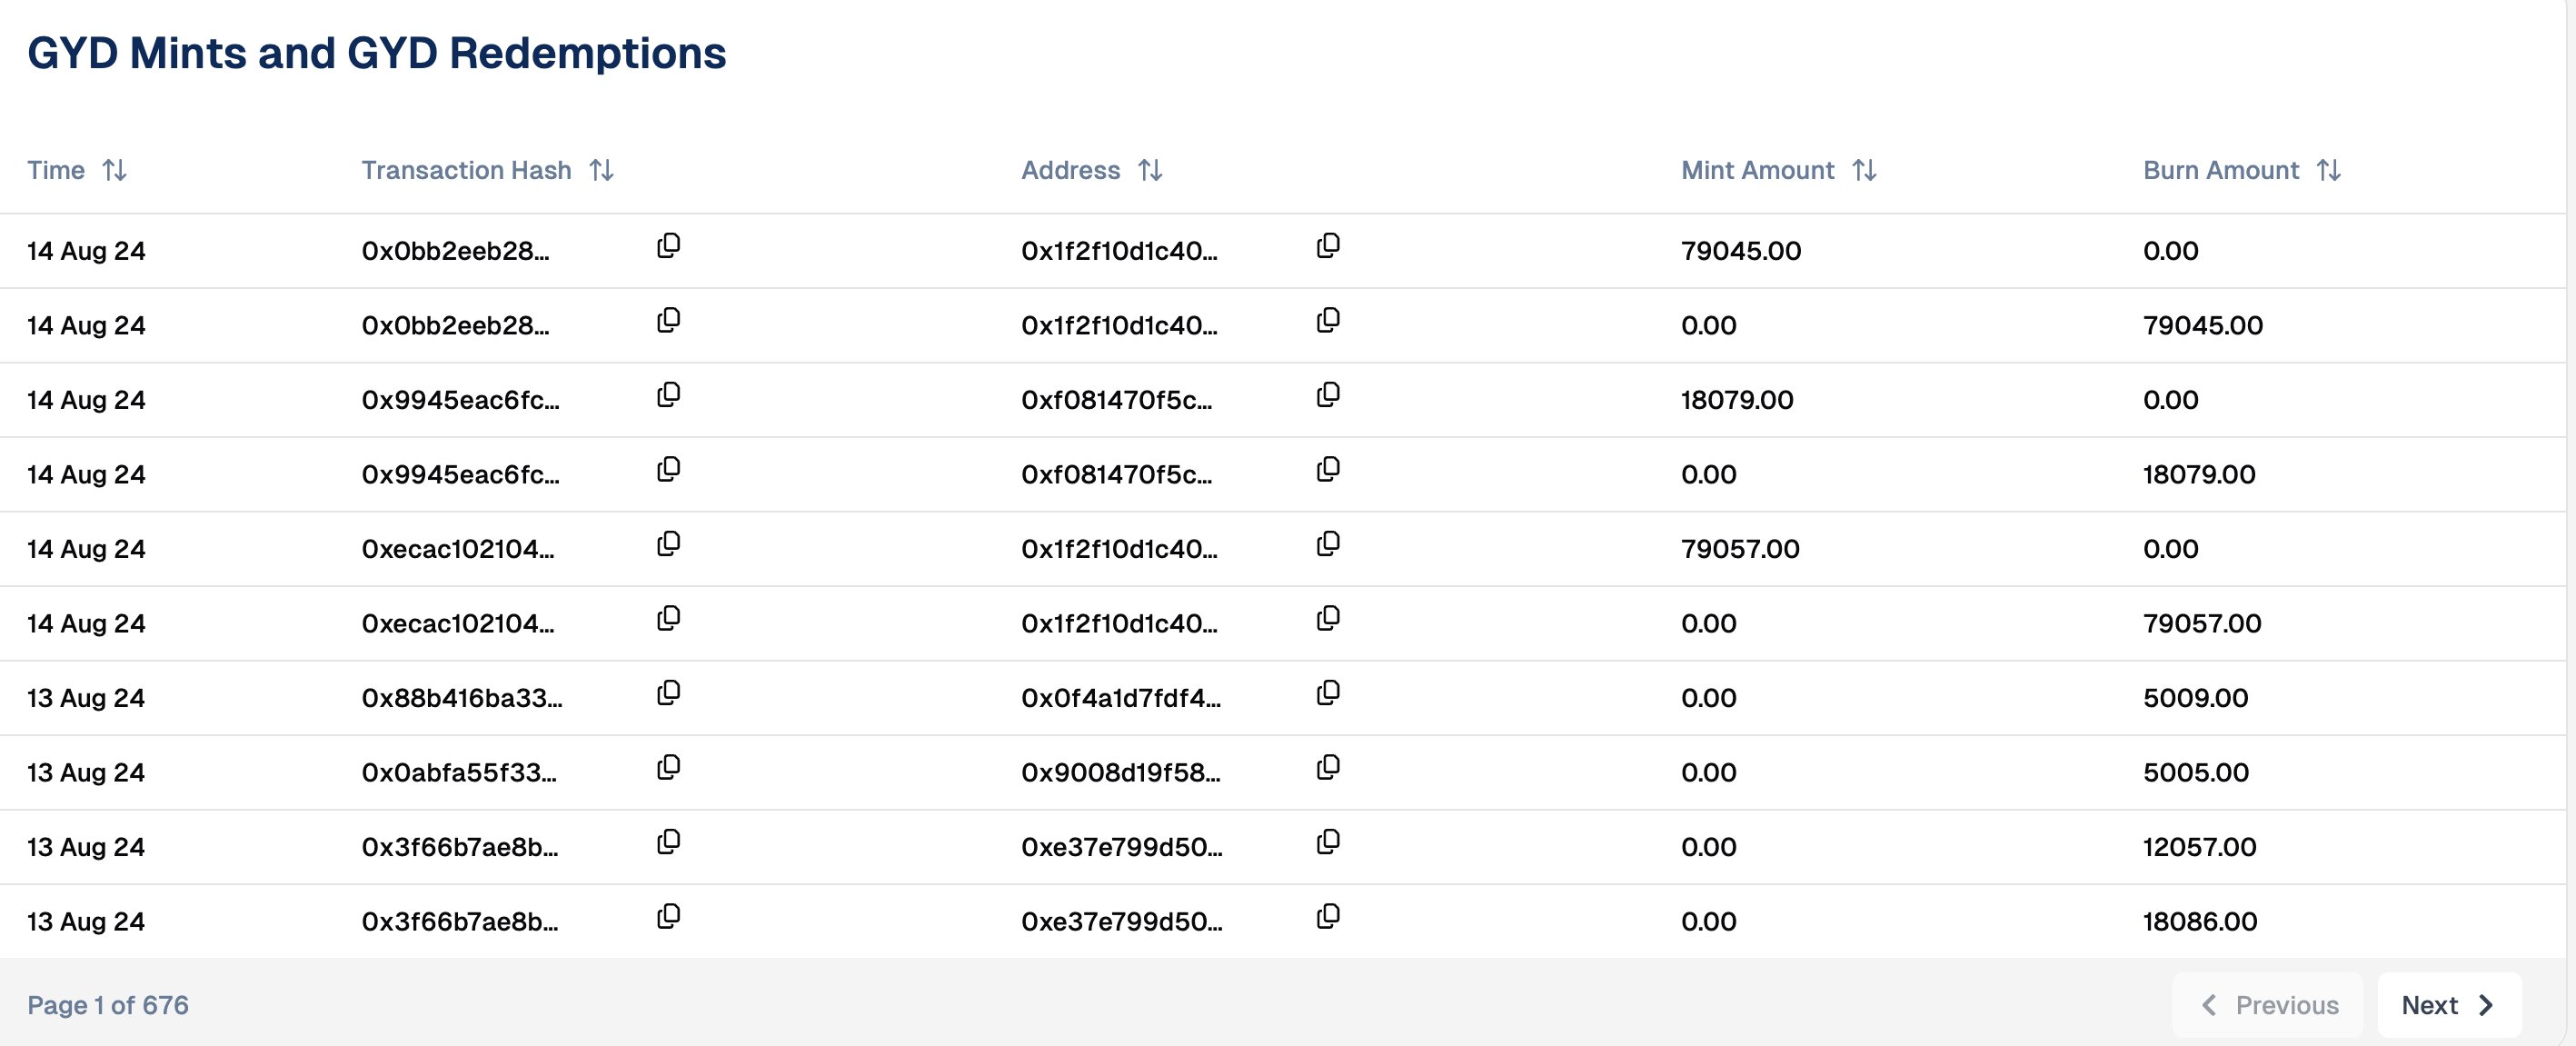
GYD Mints and GYD Redemptions features gives a comprehensive record of all minting and redemption (burning) activities for the $GYD token. It includes detailed information such as:
Transaction timestamps to track when each mint or redemption occurred.
Wallet addresses involved in these transactions, providing visibility into who is issuing or redeeming $GYD.
Amounts of $GYD minted or redeemed, showing the exact changes in the token's supply.
By presenting this data, the section ensures transparency around how $GYD's supply is adjusted over time. Users can monitor supply increases (mints) and decreases (redemptions), which helps them understand the overall liquidity and market dynamics of the stablecoin.
Pool Overview
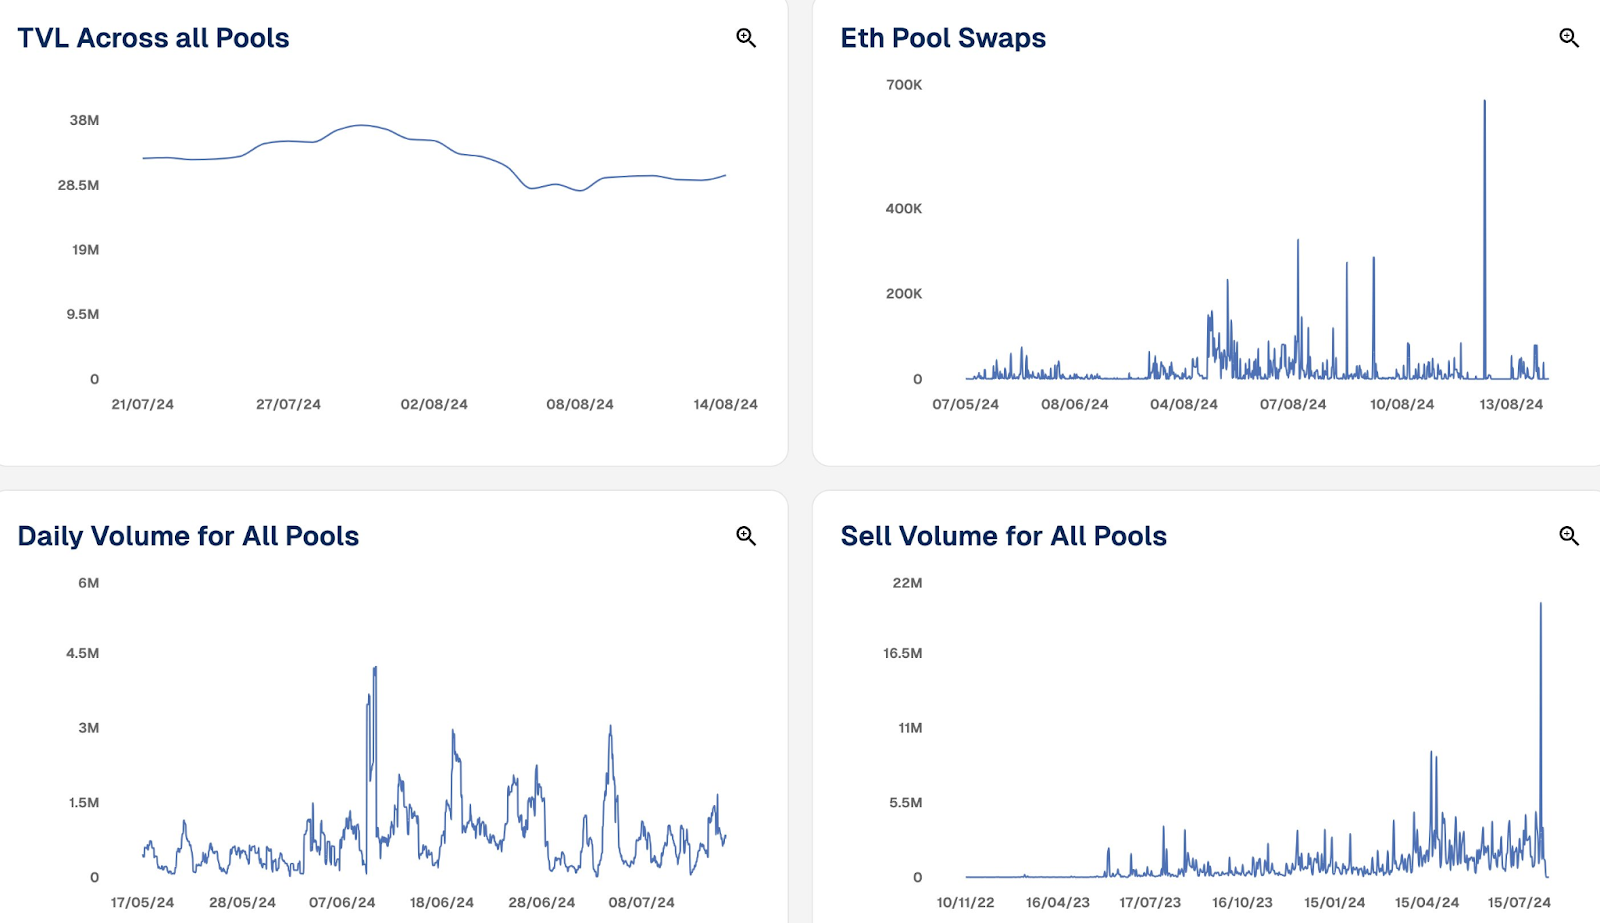
The Pool Overview section of the dashboard has been designed to provide users with a comprehensive view of $ETH pool swaps and recent trading activities, particularly focusing on sell volume events. This enhancement allows users to gain detailed insights into the market dynamics surrounding the $GYD stablecoin, enabling them to better understand how $GYD interacts with other assets, especially $ETH.
The visibility into $ETH pool swaps means users can track individual transactions where $GYD is traded against $ETH, including metrics such as transaction volumes, price movements, and trade frequencies. By observing recent sell volume events, users can quickly assess if there are significant shifts in market sentiment, such as increased sell-offs, which could indicate broader trends in liquidity and trading behavior.
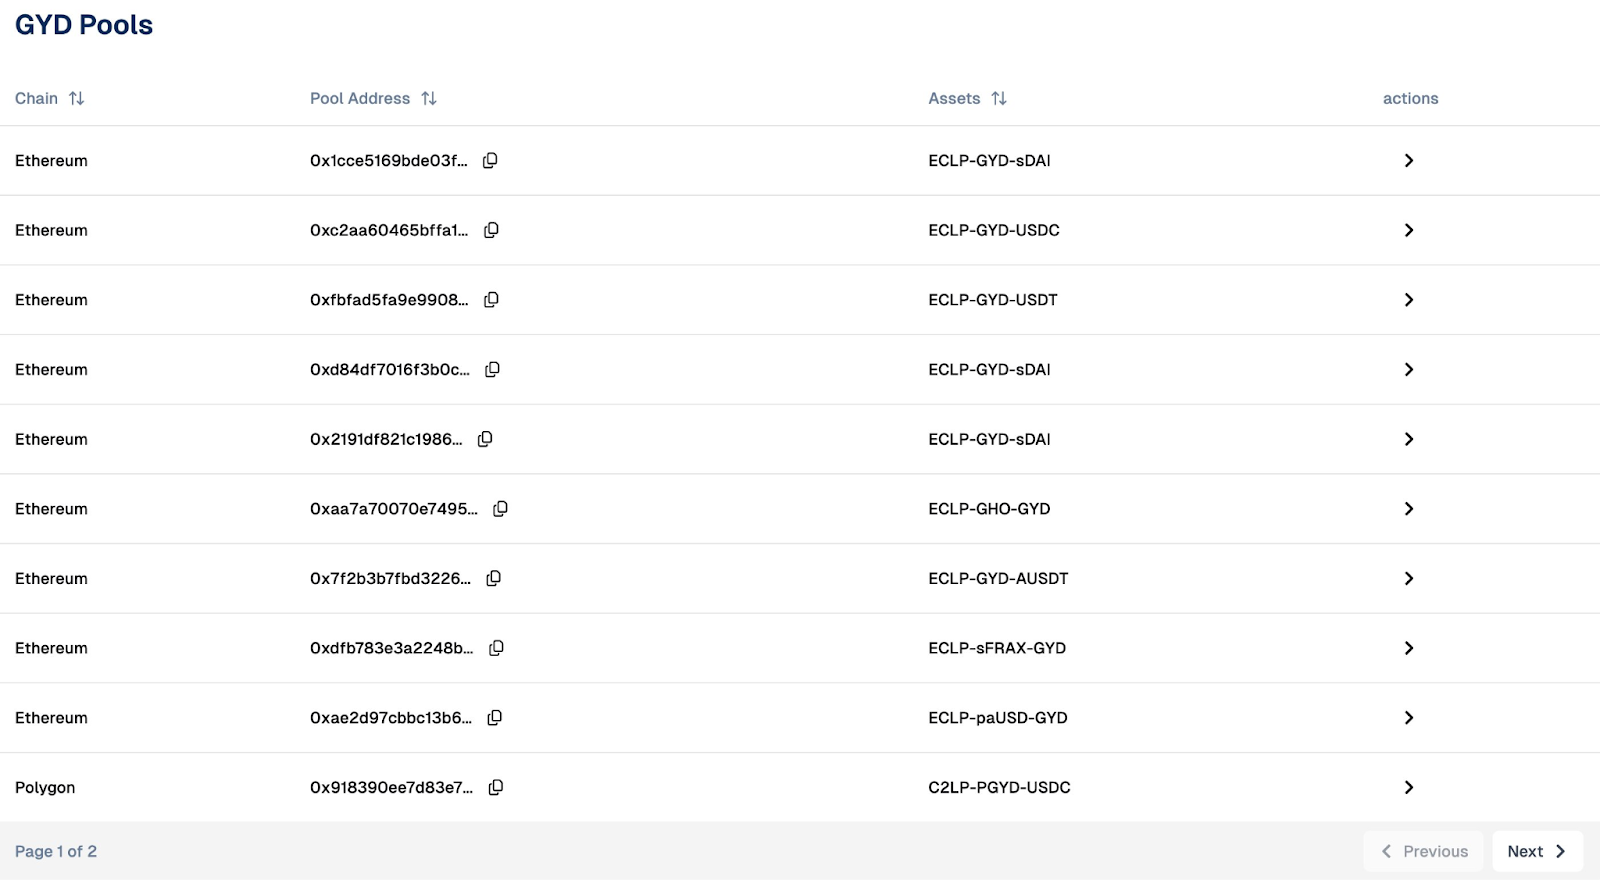
GYD Pools section offers a comprehensive view of the various liquidity pools where $GYD is traded across multiple blockchain networks. It provides a detailed list of all existing pools, showcasing pool addresses and the associated assets that are paired with $GYD. This information is crucial for users who want to engage with specific $GYD trading pairs, as it allows them to easily identify and locate these pools across different chains, such as Ethereum, Polygon, Optimism, and others.
By displaying the addresses, users can directly access and interact with these pools, whether to add liquidity, swap tokens, or analyze trading activity. Additionally, the section highlights the types of assets paired with $GYD, giving insights into the variety of liquidity options available. This feature is essential for traders, liquidity providers, and developers who need to understand the market dynamics, liquidity depth, and trading opportunities within the $GYD ecosystem.
Conclusion
Chainrisk Team has invited members of the Gyroscope community to actively engage with the platform, emphasizing its role as a tool for gaining insights into the $GYD stablecoin. Users are encouraged to explore all features and metrics provided by the dashboard to better understand the performance and stability of $GYD. This could include tracking liquidity, analyzing token supply, or monitoring trading activities. By engaging with the dashboard, community members can contribute to the ecosystem's transparency and growth.
"Donec ullamcorper nulla non metus auctor fringilla. Vivamus sagittis lacus vel augue laoreet rutrum faucibus dolor auctor."
Name Surname
Position, Company name
"Aenean lacinia bibendum nulla sed consectetur. Sed posuere consectetur est at lobortis. Lorem ipsum dolor sit amet, consectetur adipiscing elit. Cras justo odio, dapibus ac facilisis in, egestas eget quam."
Name Surname
Position, Company name
"Donec sed odio dui. Donec id elit non mi porta gravida at eget metus. Aenean lacinia bibendum nulla sed consectetur."
Name Surname
Position, Company name
"Nullam quis risus eget urna mollis ornare vel eu leo. Donec id elit non mi porta gravida at eget metus. Sed posuere consectetur est at lobortis. Praesent commodo cursus magna, vel scelerisque nisl consectetur et."
Name Surname
Position, Company name
"Donec ullamcorper nulla non metus auctor fringilla. Fusce dapibus, tellus ac cursus commodo, tortor mauris condimentum nibh, ut fermentum massa justo sit amet risus."
Name Surname
Position, Company name
Arbitrum 3rd Milestone Completion Announcement
ChainRisk has successfully completed Arbitrum's third milestone, focusing on enhancing backend & cloud infrastructure to support large-scale Monte Carlo simulations. This achievement includes scalable transaction processing, stochastic price path modeling using GARCH models, & the development of incentive optimization strategies.
November 2, 2024
Integration
Arbitrum 2nd Milestone Completion Announcement
Arbitrum completes its 2nd milestone, finalizing the simulation engine with robust security, seamless cloud deployment, comprehensive testing, & engaging community risk calls. User-friendly documentation ensures easy onboarding, while extensive simulations validate performance & scalability.
October 25, 2024
Integration
Partnership
Compound Finance 3rd Milestone Announcement
An overview of Chainrisk's economic audit on Compound V3, highlighting advanced simulations on the Arbitrum One Chain. This update focuses on optimizing risk management strategies, enhancing security, & improving capital efficiency across various market scenarios.
This update outlines the planned test scenarios for the Economic Risk Simulation Engine for Compound v3, focusing on modeling & predicting economic risks in DeFi under extreme market conditions to test protocol resilience, evaluate risk management, & identify vulnerabilities.
September 24, 2024
Integration
ChainRisk Blog
Recent research and blog articles
Superlend Economic Risk Assessment Report
Explore an in-depth economic risk assessment of the Superlend protocol on the Etherlink chain. The report analyzes risk parameters, liquidity, and volatility across assets like WBTC, WETH, USDC, USDT, and XTZ, offering recommendations to balance capital efficiency and risk management.
September 24, 2024
Compound V3 Economic Audit Announcement
An in-depth overview of Chainrisk’s economic audit on Compound V3, focusing on advanced simulations on the Arbitrum One Chain. Discover how optimized risk parameters enhance security, capital efficiency, & resilience across various market conditions in DeFi.


.svg)
.svg)